tl;dr
- Mixed mode assembly (a feature of .NET binaries), involving both C# as well as C++ code in the same executable
- Code flow jumps between both C#/C++ frequently to make analysis harder
- SEH mechanism triggered in C++ code, which uses SEH trampoline to make debugging harder
- SEH triggered once again in C#, which is handled by C++
- VM bytecode is decrypted loaded by C#
- VM checks input in 4 ways: CRC32 hash (2 byte pairs), RC4 encryption, rolling XOR and byte by byte checks
Challenge Description
An ancient engine stirs in the dark. It speaks no language you know.
Prelude
[Note: I will be showing you the author mindset, on how one can approach such a challenge - this will not be a very ctf-style writeup, but more of a teaching process]
After reading this writeup, you will (hopefully) be able to:
- Identify and analyse Mixed Mode .NET samples
- Reverse Engineer a custom Virtual Machine
Analysis
I will be splitting this writeup into 3 main parts:
- What is mixed mode assembly?
- Reversing mixed mode samples (using this challenge as an example)
- The VM
Before jumping into reading this, I would suggest some prerequisite reading on the following topics:
- What is .NET? (My blog which explains it, Microsoft reference, Reddit)
- What are “managed” and “native” methods? (Medium post, Microsoft reference, GFG)
Mixed mode assembly
What is mixed mode assembly?
A mixed mode assembly in .NET refers to a compiled binary that contains both managed as well as unmanaged code. To break that down:
- Managed code is the code that runs under the control of the .NET Common Language Runtime (CLR). Examples of this include C# or VB.NET code
- Unmanaged code is code that runs directly on the Windows OS without the CLR’s oversight, and this is typically written in C/C++
Why use mixed mode?
Functionally, there are many beneficial use cases of having both managed as well as unmanaged code in the same binary. Some of them include:
- interoperability between the two modes
- Optimising performance-critical sections of managed code (C++ runs way faster than managed code)
- Leveraging existing code by taking advantage of interoperability between managed and unmanaged code
They are enabled using C++/CLI (Common Language Infrastructure), which allows C++ to interoperate directly with .NET classes. This allows you to write native code as well as managed code in the same project and even in the same source file.
How does it work under the hood?
Mixed mode assemblies are unique because they satisfy two very different runtime expectations simultaneously: the native Windows loader and the .NET CLR. How does this work in practice though?
- A mixed mode binary is still a standard PE file
- It contains both:
- Native sections:
.text,.data,.rdata, etc., compiled from C++ - Managed metadata: a CLR header, metadata tables, and IL bytecode (if present)
- Native sections:
- When the OS loads the binary, it sees the native entry point (
WinMain) and begins execution like a regular native application - Simultaneously, because the PE includes a CLR header and its metadata, the .NET runtime is also initialised and loaded via the
_CorExeMainor_CorDllMain, depending on whether it’s an EXE or DLL
Loader behaviour
- The Windows PE loader first processes the native parts. This allows the mixed mode assembly to include custom startup routines written in native code
- Usually, this begins with
mainCRTStartup, which is the standard C runtime startup stub generated by the MSVC toolchain. This stub sets up the runtime environment, initialises global variables, and eventually callsmain,WinMain, orwWinMain- depending on the system - In a mixed mode assembly, this native entry point might call
_CorExeMain, which is responsible for bootstrapping the CLR - These two systems coexist in the same process space, which is what makes mixed mode so difficult to analyse
Note: Not all mixed mode binaries use mainCRTStartup directly. Some may use a custom entry point or modified CRT startup to gain more control over execution flow. However, in most cases compiled via standard C++/CLI, mainCRTStartup is the default native entry point.
- Functions written in managed code can call native functions using
P/InvokeorDllImportattributes - Native code compiled with C++/CLI can directly reference and instantiate managed types
- This means the transition between C# and C++ isn’t just at a function-level - it can go as deep as shared objects and class methods
In essence, mixed mode assemblies live in both worlds simultaneously. They can present a well behaved .NET facade while hiding all the juicy logic and the humble malware code on the native side (which are completely opaque to most .NET tools).
Reversing a Mixed Mode sample
So let us begin analysis of this sample as we would for any binary - starting from how you would even identify whether a sample is mixed-mode or not.
Running file on the sample tells us it’s a x86-64 Mono/.NET assembly file
This does not wave any red flags, just tells us this binary has managed code. Nothing too special.
One thing I like to do to get this confusion out of the way always is to open the binary in a PE-inspection tool like CFF Explorer, and check out if it has a IL entry point or not.
The way to do this is to check the Flags section in the .NET Directory of the binary (I am using CFF Explorer).
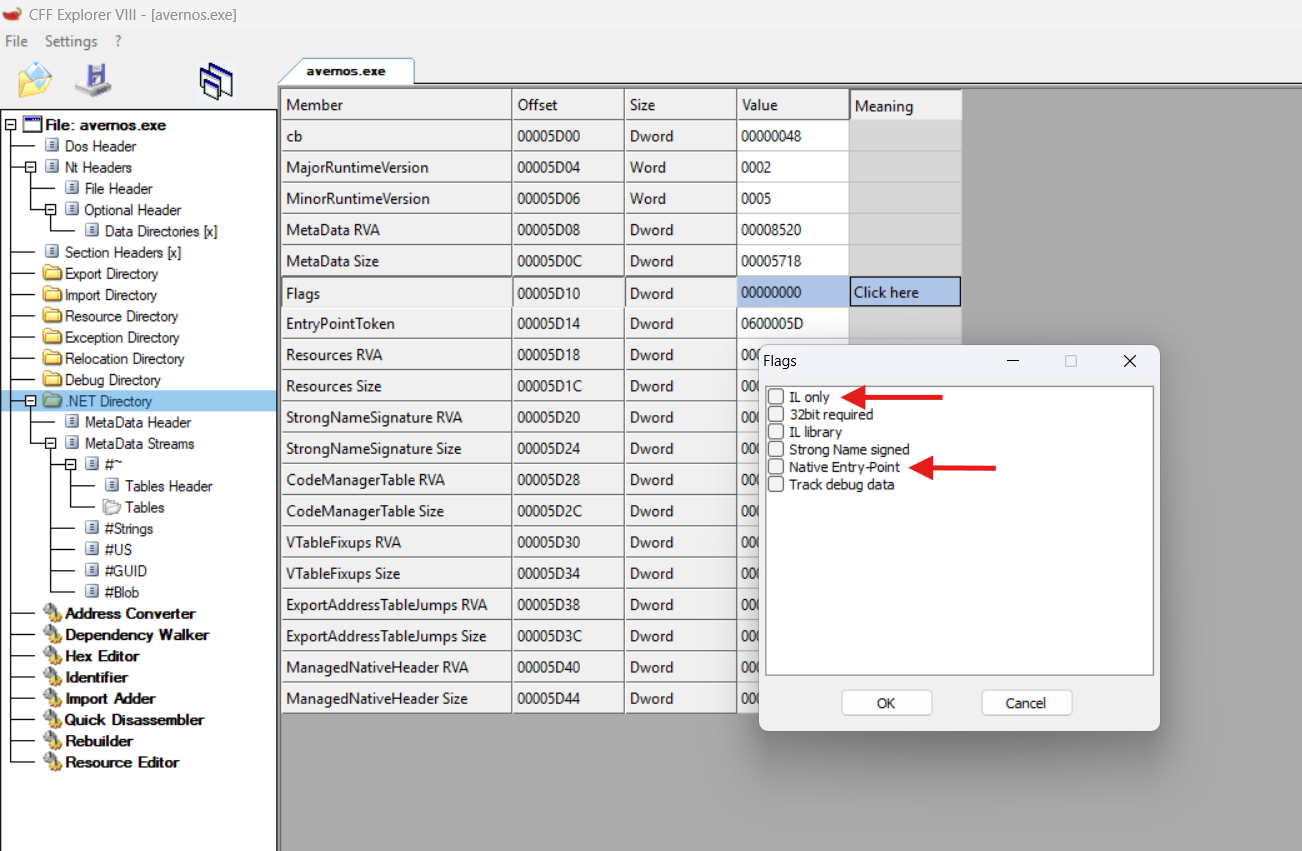
Check out the 2 flags I’ve highlighted, these say right off the bat that:
- The binary contains stuff which is not IL code
- The binary does not have a native entrypoint
Which means: The binary contains native code and it’s startup is in the managed code (which is most definitelymainCRTStartup)
Now that we know where the code execution is about to begin, let’s open up the binary in a .NET decompiler (I prefer dnSpy for these).
Another dead giveaway that this binary contains native code is the existence of CPP metadata as shown in dnSpy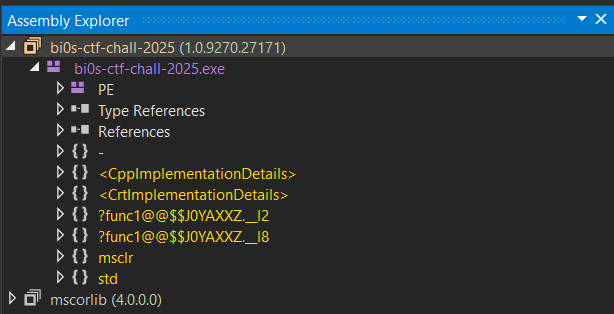
Looking for mainCRTStartup in dnSpy:
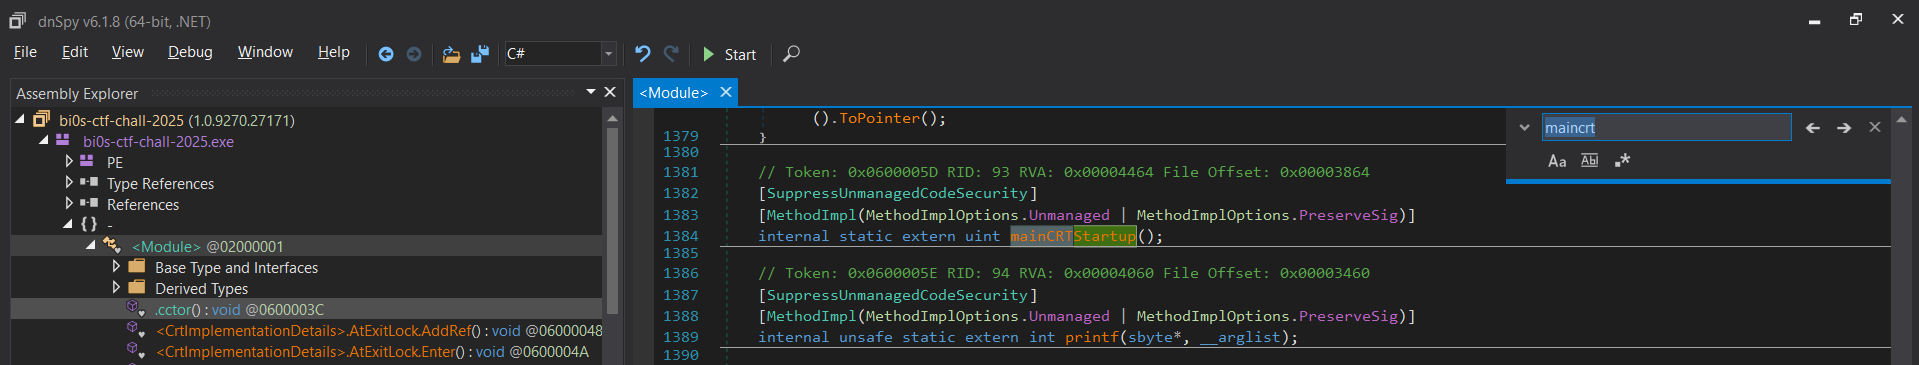
Okay, three terms to note before we proceed:
Token
- A unique identifier given to every metadata object (like a method, type, field, etc.)
- A 4-byte value where:
- The high byte indicates the metadata table type
- The low 3 bytes indicate the row index in that table
- In our case:
0x0600005D:0x06->MethodDeftable (all method definitions) (Source)0x00005D-> Row index0x5D
- More of this info can be found within
ILDasmordnSpyitself
RID
- This is shorthand for the row index inside the metadata table
- It’s the “number” part of the token
RVA
- Relative Virtual Address, is the offset (in memory) from the image base (typically
0x14000000) to the method’s actual compiled code in the PE’s.textsection - This is where the JIT compiler (or loader) will find the native stub or unmanaged entry point
- If you open the binary in IDA/Ghidra/Binary Ninja, and go to the offset
0x4464, you will find the implementation of the method/function.
File Offset
- The raw byte offset in the file where this method’s code resides on the disk
- This is useful when:
- Looking at the binary in a hex editor
- Manually extracting or patching bytes
- Mapping RVA to file offset via PE Header section tables
So now we know the address of the mainCRTStartup method in the native section, it is simply the base address of the loaded image in IDA + the RVA of the method as shown by dnSpy.
Now, one thing to note when loading it in a native decompiler/disassembler is to specify to your tool to load it as a PE file as compared to a Microsoft.Net assembly file.
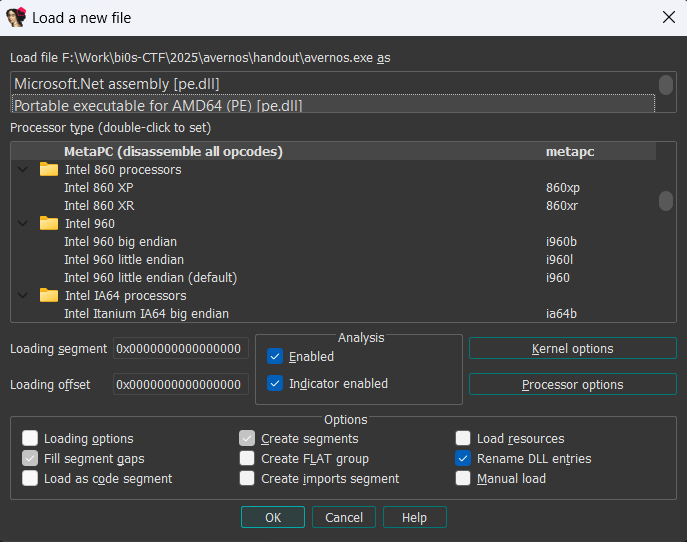
Now, hit G to be able to jump to any address, and paste the base_addr + RVA value into the field. (Find the base address from Edit -> Segments -> Rebase Program, and copy the Value field from there - for me, the base is 0x140000000).
So the address to jump to, would be 0x140004464
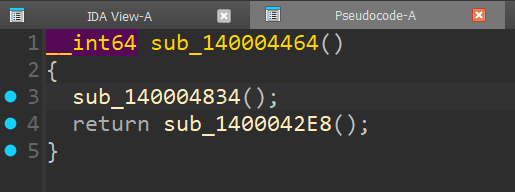
And just like that, we have our “main” (well, not really)
In standard Windows fashion, we need to do a little more digging before we actually find the main code. The first function called usually only performs setup for the actual code to run, which would be the one being returned.
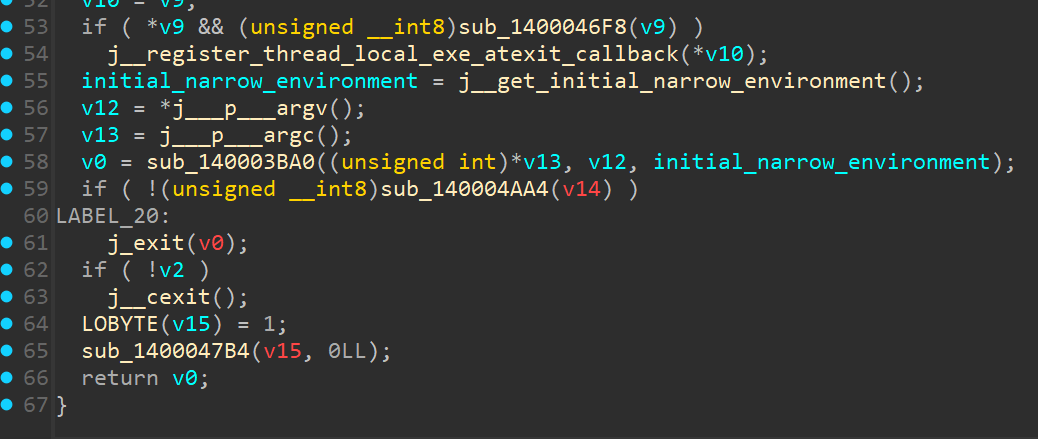
Similarly, in the next function - look for the 2nd to last function being called after argv, argc and envp are initialised. For us, that would be the function at 0x140003BA0 (line 58 in my decompilation).
Finally, we can start analysing the actual main function of the binary.
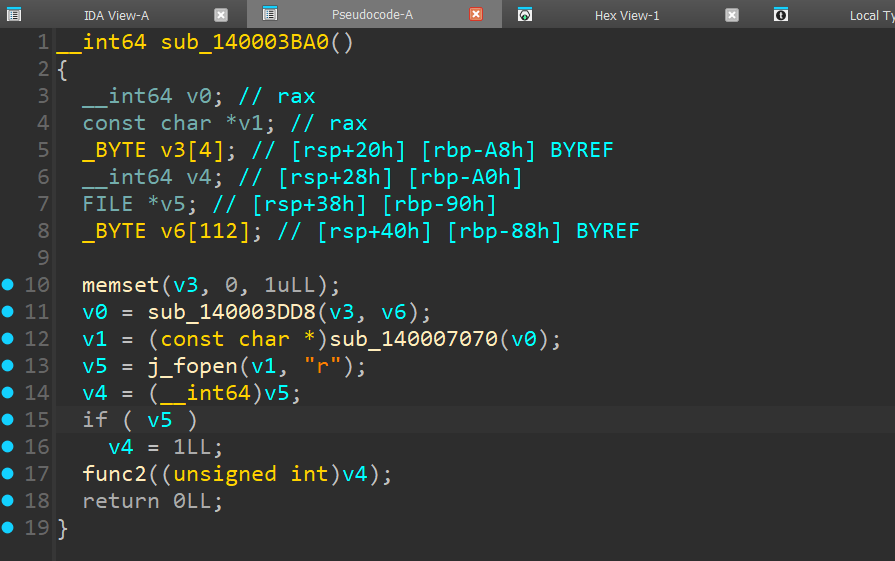
From some looking, the function at 0x140003DD8 seems to initialise an array with some unknown values, copies that to the argument passed, then returns it. This return value is then passed to the next function.
But if we look at 0x140007070, it just seems to be pointing to some qword value, which resolves to 0x6000011 - what could this be?
This is actually the Token of the method being called from C++ -> C#, and we can use this as a lookup value to find the actual function in C# being referenced.
If we hop back to dnSpy, and lookup that value in the same <Module> place we looked at before, we see this
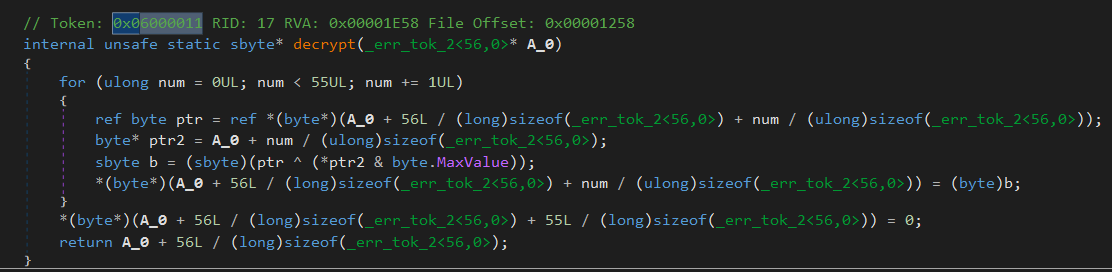
We can see this performs a XOR decrypt of the byte array provided to it and returns the corresponding result to v1, which is meant to be a file which is to be opened in read mode, and the file descriptor returned to v5.
The path of the file returned is /home/the.m3chanic/bi0s-ctf-25/crazy-path/hehe/flag.txt - which is obviously not going to exist on a given machine. Let us see how this file descriptor is being further used.
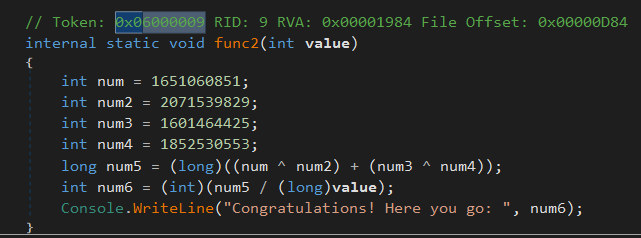
In the remnant of the function, we can see func2(fd) is being called with the file descriptor of the flag.txt file (which, does not exist btw), which again points to the TID 0x6000009, which if we lookup in dnSpy gives us
[I wrote this writeup over multiple days, and it seems my IDA database decided to rebase itself to a different address, the concept of mapping a function from dnSpy to a native decompiler still remains the same though! You can refer to this updated base address hereon: 0x7FF7DF220000]
It seems to set up some values, and then XORs something and then divides them with the value it was passed as a parameter. Now we know this value is 0 on our machine, but wouldn’t that cause a DivideByZero exception?
Let us take a look at the assembly when func2(fd) is being called.
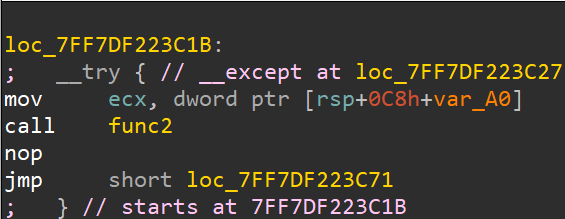
Aha! So it is being set up inside a try block, and the exception handler for that block is present at 0x7FF7DF223C27, let us see what happens there.
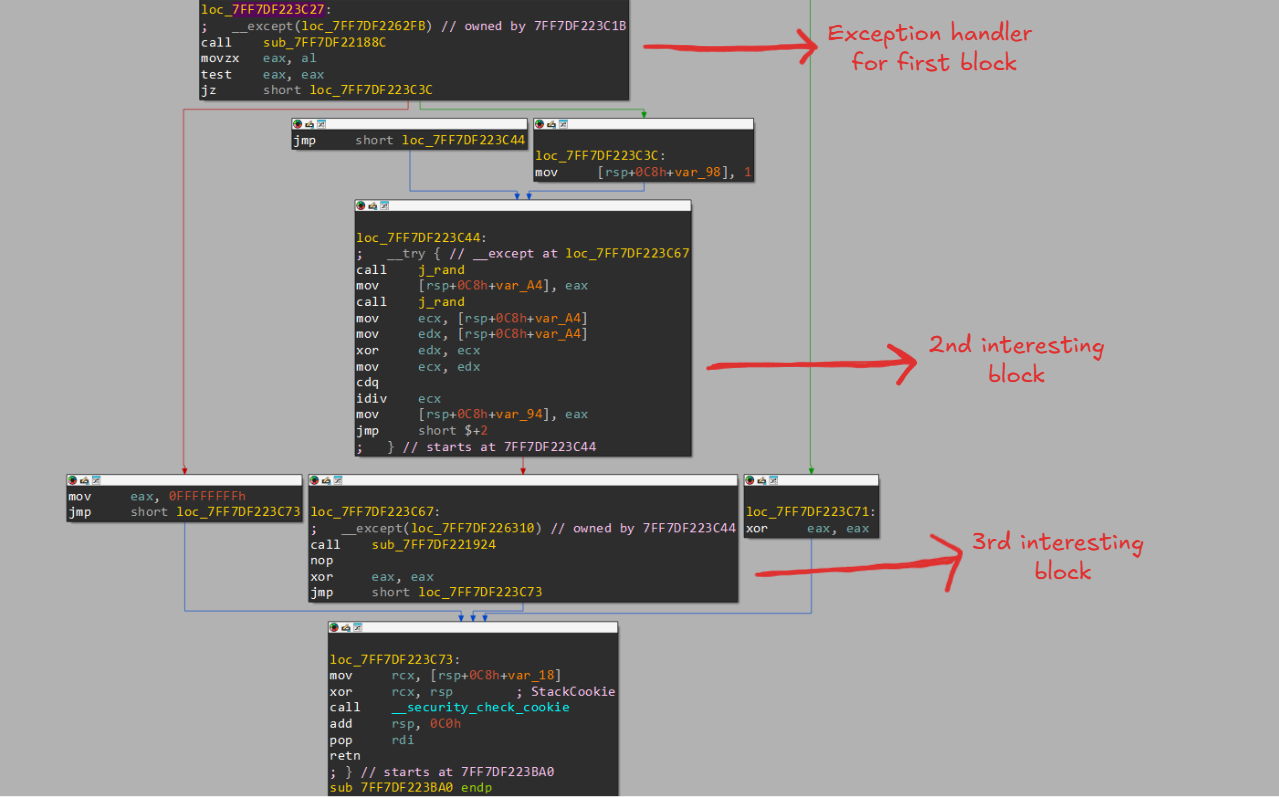
So as we can see, in the exception handler for our first exception, it is calling a function at 0x7FF7DF22188C, and based on the return value it either exits from the main function or it enters our 2nd interesting block - so it is definitely worth checking out.
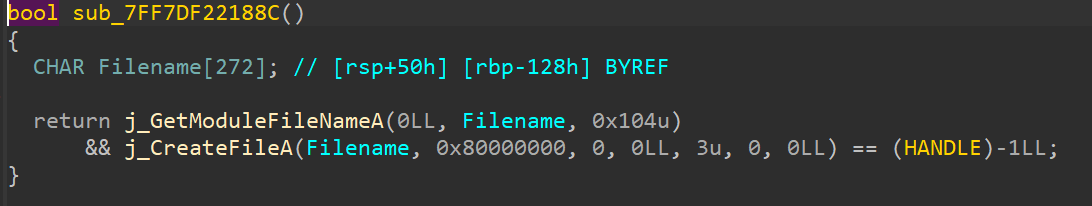
This is a classic anti-debug check, wherein it tries to open the file of the current process. Usually, debuggers read the debug information of the process from the file - and if this handle is not closed then the process cannot open this file - meaning that a failed call indicates the presence of a debugger.
To bypass this, we can just patch out the call to this anti-debug function with nops and patch the jz to a jmp.
The 2nd block is quite easy as well - it calls rand(), xors the result with itself and calls rand() again and attempts to divide the result with the result of the previous xor (which would be 0) - thus causing a DivideByZero exception yet again.
If you observe closely, even this 2nd block is wrapped in a try, which means our except (at 0x7FF7DF223C67) must be where we should look.
Looking at the block, it calls 0x7FF7DF221924 - which has the same routine as the 2nd interesting block, which again has the same routine - which eventually calls func6().
What we just witnessed in assembly is what I would call a trampoline of sorts. It looks something like this in pseudocode:
1 | void trampoline1() { |
The way to bypass such exception checks is to identify the address of the handler (in our case, the __except block) and set a breakpoint there. Then, let your debugger run and when the exception occurs - pass it to the application instead of letting the debugger handle it. This is the standard way to handle most exception handler checks.
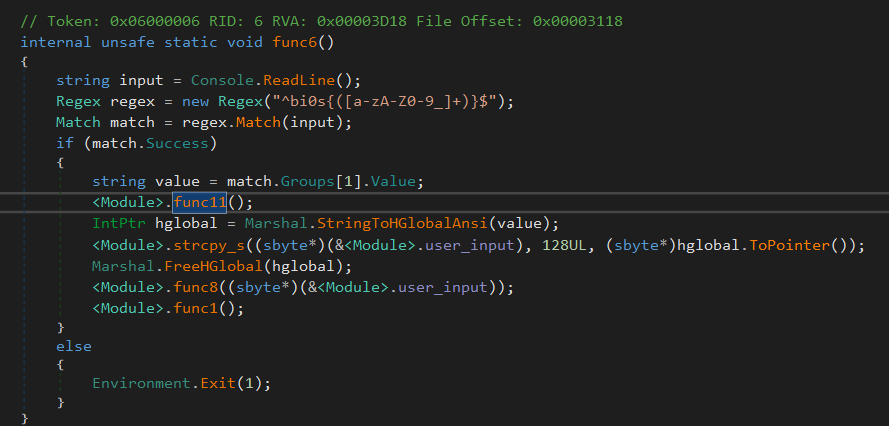
Again, func6 has the token 0x6000006, let us inspect that in dnSpy.
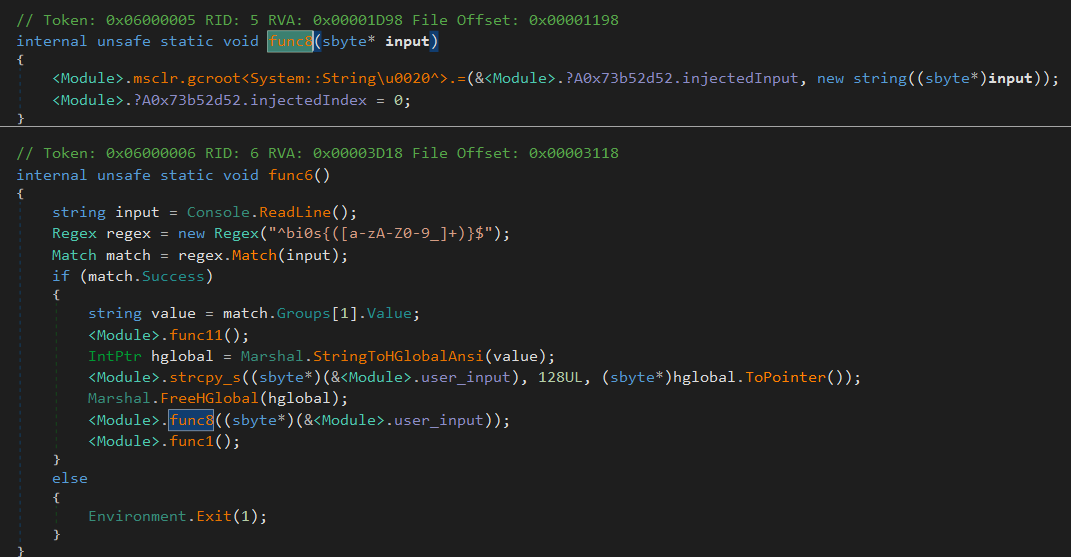
Finally! Some actual stuff.
This function seems pretty straightforward, too. Asks for user input in the pattern bi0s{...} and extracts the content within the flag format.func8() is then called with that input as a parameter.func8() does nothing but inject the extracted input into the input stream.
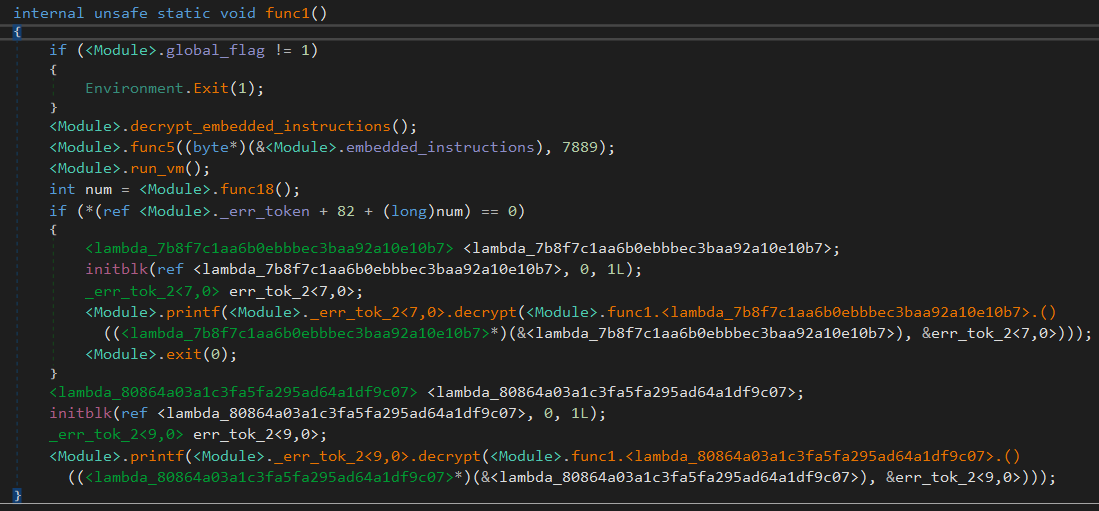
It also calls func1()
(I may have forgotten to remove the names of some of the symbols, so this part accidentally gave away the fact that this is a VM ☠️ nevertheless let us proceed as if we do not know it and see how we can identify one naturally)
It:
- Checks to see if a variable
global_flagis set to 1 or not, and exits depending on that - Calls
decrypt_embedded_instructions() - Calls
func5() - Calls
run_vm() - Based on the result of
run_vm(), will print either of 2 things (which we can guess will be something along the lines of “true” or “false”)
Let’s break these down step by step.
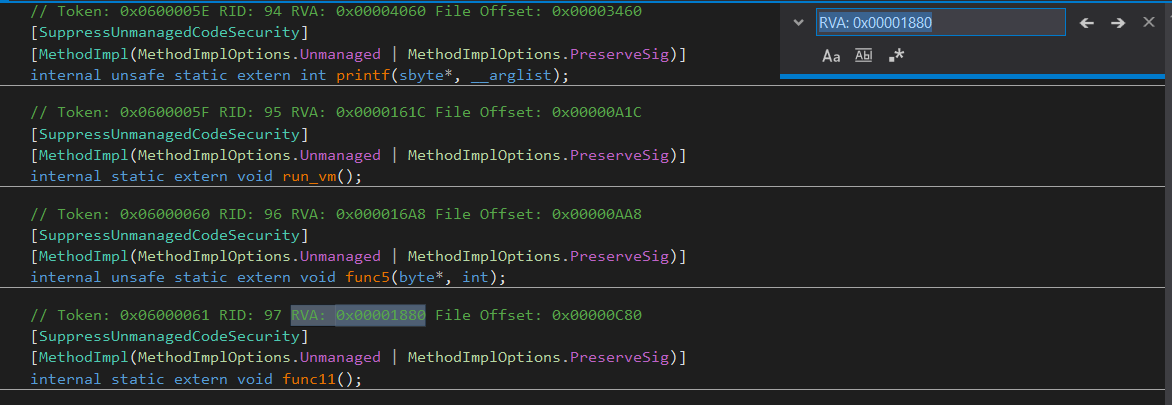
global_flag is defined at the RVA 0x191B0, which in IDA maps to a global variable. You xref that, you find it is referenced once at a function whose RVA is 0x1880. You can look up this RVA now in dnSpy.
Right click -> Analyse func11(), and you can find cross references to that function in dnSpy.
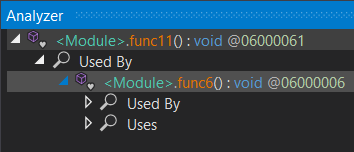
We can see that our main logic function (which, if you recall occurs right after an anti-debug check), is benignly setting this variable. No biggie.
Let’s take a look at what decrypt_embedded_instructions() does.
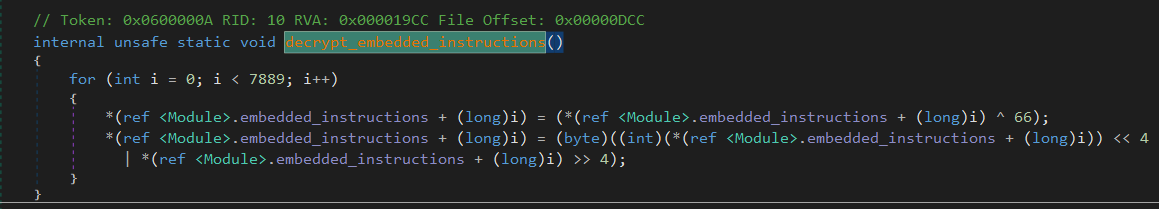
It seems to be taking an array embedded_instructions, and performing the following operation on it:
1 | embedded_instruction[i] ^= 66; |
Then, func5() seems to be defined natively, so we can take a look at that next
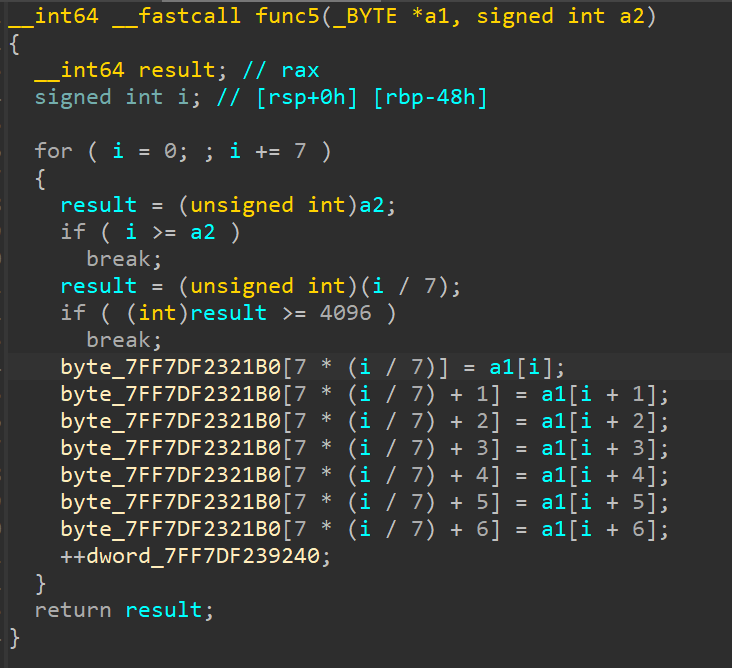
This function seems to be copying bytes from the first argument passed, to a global array. The array passed is embedded_instructions, which was just previously decrypted. A counter seems to be incremented for each loop iteration - let’s call that unc_counter for now. Although we do know it’ll contain the total number of instructions present in the VM.
Aaand next up, we have run_vm(), which is going to be our key function to reverse. It is defined at the RVA 0x161C.
A quick recap before we proceed:
- Some anti-debug checks (using the
CreateFileWAPI and SEH) - User input taken in C# using regex, which is injected into the input stream
- Global flag is set to true
- Another exception trigger from C#, which is handled in C++ then handed back to C#
- An unclear array is decrypted and loaded into a global buffer
- A function
run_vm()is called
The VM
0x7FF7DF221530 sets that memory region to 0.
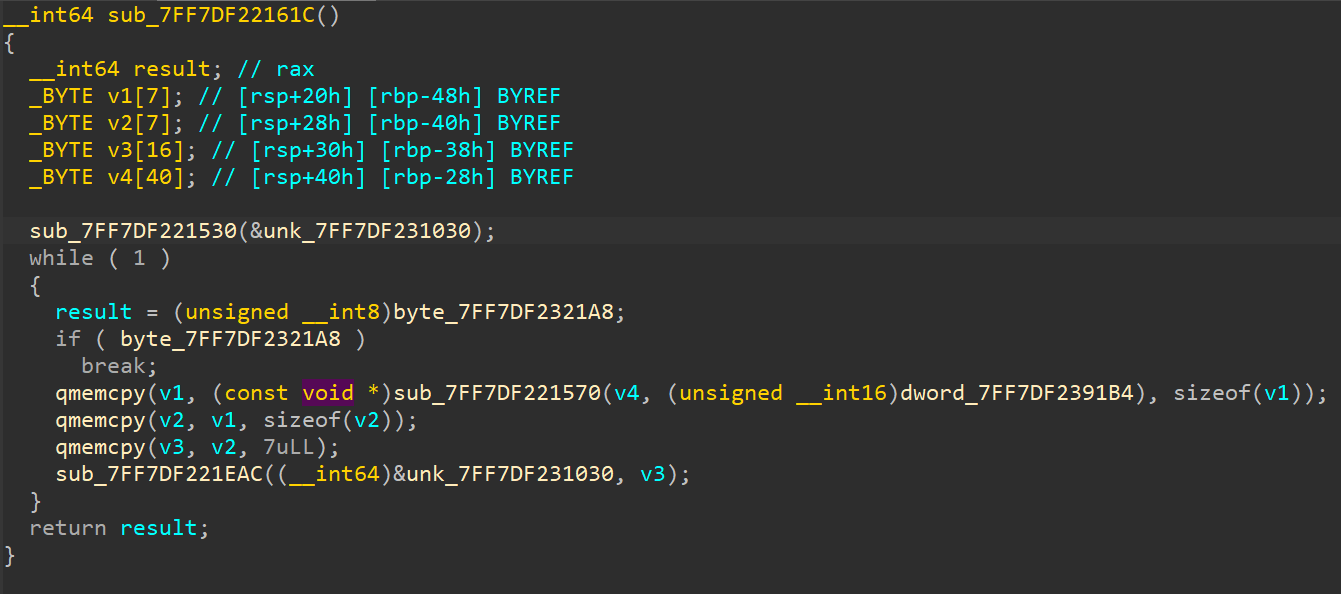
If we look closely at the function defined at 0x7FF7DF221570,
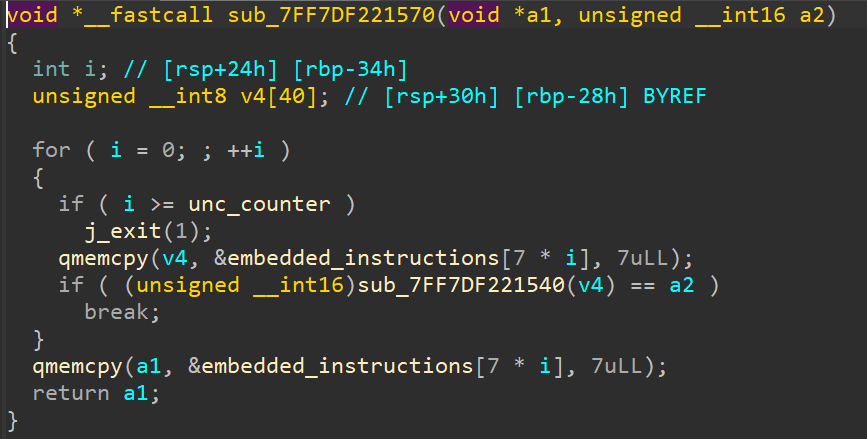
We can see there is a loop being run whose iteration count is the number of instructions loaded into embedded_instructions. It is loading each element (7 bytes long) from the array, and passing those 7 bytes into a function at 0x7FF7DF221540 and checking its return value against something.
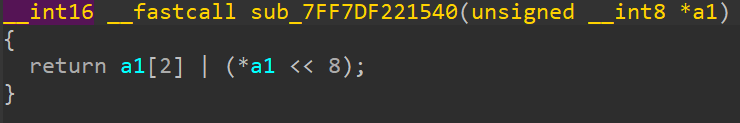
This returns a WORD (16 bit) value in the format [byte_0 << 8 | byte_2]. Generally, when we see such weird indices being indexed (especially from a 7 byte long value?), it indicates that the value being indexed might be a structure - and these are members of the structure being accessed.
So assuming that it is a structure, we can proceed with a simple structure definition as follows:
1 | struct unc_struct { |
After changing all relevant occurances of 7 byte arrays to this structure, we can now continue analysis of this function.
There is only function call left, which is to 0x7FF7DF221EAC, which takes the memory region previously initialised to 0 and the return value of the previously called function.
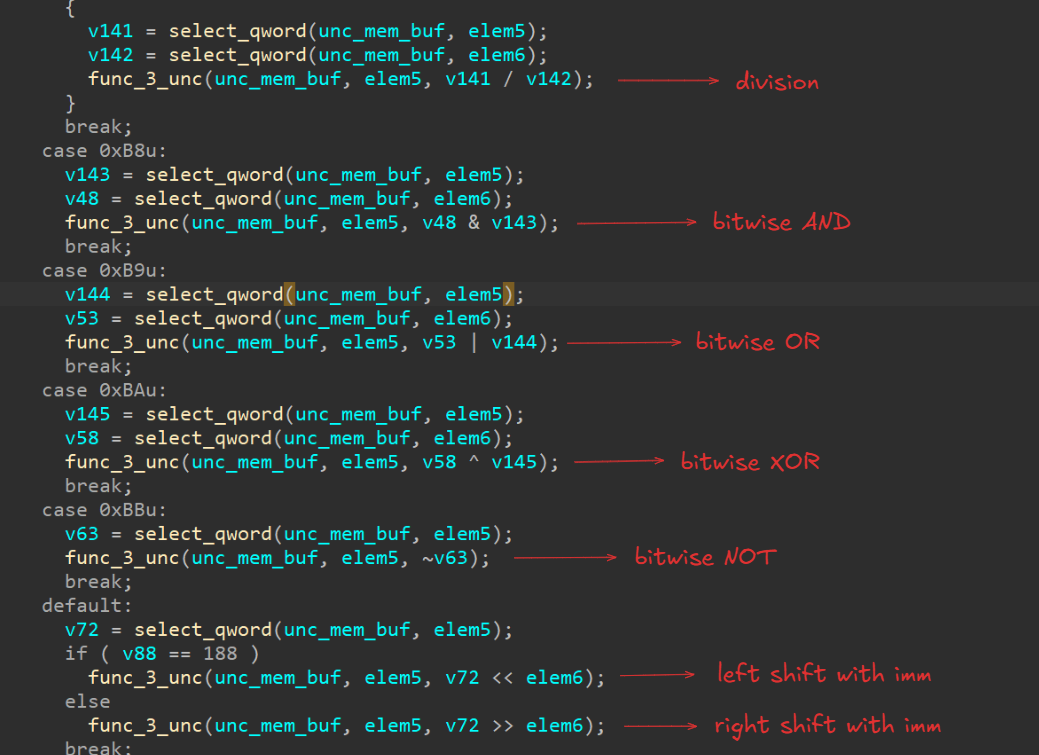
Frankly, there’s quite a bit to grasp in this function - lots of weird memory accesses and a ton of cases to analyse. A good practice to follow in cases like these is to see if you can find a pattern/generalise the instructions and see if they’re performing something at a higher level.
Let us see what patterns we can figure out at first glance from this mammoth function:
- The same functions being reused in a lot of places (e.g:
0x7FF7DF2210B0,0x7FF7DF2211F0,0x7FF7DF221370,0x7FF7DF221170,0x7FF7DF2211B0,0x7FF7DF221230,0x7FF7DF221330,0x7FF7DF2212F0,0x7FF7DF221550). These might seem like a lot but it’s just 9 or 10 functions to reverse which are virtually being used in every case - so if you rev these you rev this entire mammoth! - A lot of simple arithmetic being performed in each individual case - indicating that this function might be a virtual machine
- The same “control variables” being used in a lot of places - i.e, these variables are used to determine the return values of many functions
With this in mind, let us start analysing those repetetive functions one at a time.
(I’ve renamed each of the functions in the list above in the format func_{i}_unc)
If you look at each of the functions in the list above, you will notice a few more patterns. Let us go through each of them here.
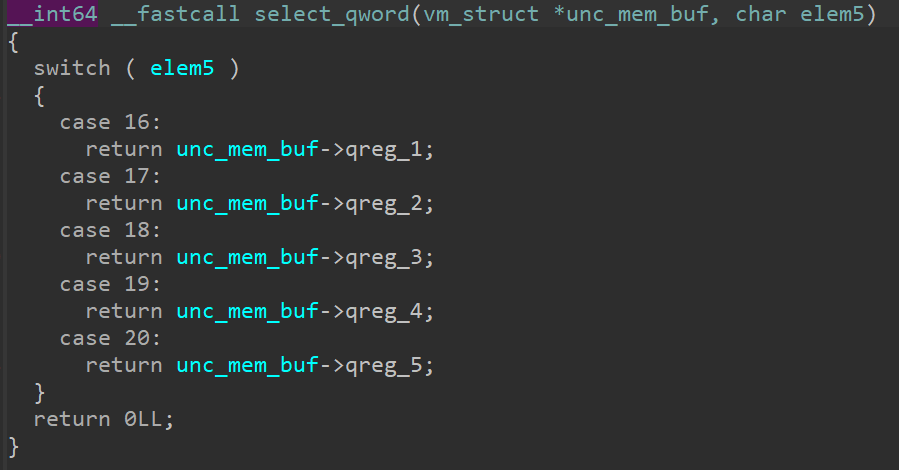
unc_mem_buf being passed as the 1st parameter, and elem5 being passed as the 2nd parameter. The function uses elem5 as a “control variable” to pick and return a value from the unc_mem_buf.
The list of functions that matches this criteria is:
func_1_unc: Takesunc_mem_bufas achar *and returns 1 of any 10 bytes from the 0th-10th indices ofunc_mem_buffunc_4_unc: Takesunc_mem_bufas ashort int *and returns 1 of any 5wordsfrom the 10th-20th indices ofunc_mem_buffunc_5_unc: Takesunc_mem_bufas aint *and returns 1 of any 5intsfrom the 20th-40th indices ofunc_mem_buffunc_2_unc: Takesunc_mem_bufas along long int *and returns 1 of any 5qwordsfrom the 40th-80th indices ofunc_mem_buf
We can confidently rename the above 4 functions to select_byte, select_word, select_dword and select_qword respectively.
It is highly risky to define a structure without knowing its size first. However, from the previous function we know that the size of unc_mem_buf is 4466 bytes. So we can define a structure with what we know so far, and leave the rest as pad.
If we analyse the usage of the return values from the above - we can see that these are being used in the operations that we noticed earlier which hinted at this function potentially being a VM.
A similar case for the other functions as well. This indicates that those return values are potentially “registers” that are being used inside our VM, meaning that the select_* functions we uncovered earlier are in fact functions to select a register from our VM.
If we were to define this in a strucure now, it would look a little something like:
1 | struct vm_struct { |
It would also be a good idea at this point to rename unc_mem_buf to vm_state.
Looks much cleaner now! Let us continue our analysis.
So considering that this is a VM - we’ve found the registers and the functions that select them - obviously there should also be ones that set them, right? Analysing the rest of the func_*_unc functions, seems like those are it.
An additional element in these functions would be the value to “set” the register to, so let’s keep a look out for those too.
After similar analysis as before and some type fixing:
func_3_unc->set_q_registerfunc_6_unc->set_b_registerfunc_7_unc->set_d_registerfunc_8_unc->set_w_register
I’ve also renamed the “selection” functions in a similar format, i.e, get_*_register
The entire function looks a lot cleaner and more understandable now. It is a clear cut VM. Let us note some more interesting points from further analysis:
vm_state->pad[0]is consistently used in bitwise assignments and comparisons, which indicates it might be some kind of a “flag” register. Let us rename it toeflags(x86 standard)v68(the return value of the function at0x7FF7DF221CF0) seems to be the main control point of the entire VM, indicating it might be the opcode. This means we would need to analyse how that is being generated.- In the cases that do use the (now)
eflagsregister, we can see there is a particular function being called in each one: namedfunc_9_unc. Usually,eflagsis only checked in the case ofjmpinstructions. - There are some yet-to-be defined functions. Upon some inspection, these seem like they are taking a value as an argument, and placing those in a buffer that is part of the
vm_state. These are nothing but memory write/memory read instructions.
We do not have enough context to fully understand func_9_unc yet, so let us switch and look at how that opcode is formed.
It takes elem2 and elem4 from our struct, and passes it to some function defined in C#.
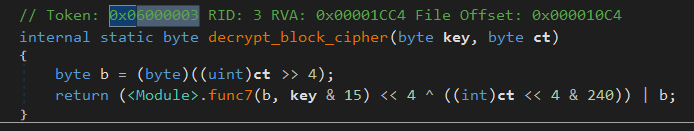
So the first param is some key, and the second is the ciphertext. Does this mean that each “instruction” (7 byte) is storing the real opcode with the encrypted opcode as well as the key to decrypt it, embedded inside? Let us update the structure with the same.
elem5 and elem6 in the struct seem to be used as arguments in almost every case in the VM. These might just be the operands for the instruction. Let us change those too.
Now, for another important function: 0x7FF7DF221540. This is called twice in the entire binary, once in the VM function, and again when deciding which instruction gets executed next in the VM. So let us take a look.
For the function that calls it (0x7FF7DF221570), the 2nd argument passed to it is the global variable at 0x7FF7DF2391B4, which is interestingly incremented after each time the VM function executes, so it might be some kind of program counter.
That function simply returns a packed form of elem1 and elem3 in the structure. This seems to be the control point for determining which instruction among all the instructions are to be executed. This could be some kind of value that indicates the “index” of the instruction present in memory, which indicates the order in which they are to be executed.
Keeping all this in context, revisiting func_9_unc gives us a better idea of its working: it simply calculates the “address” (or in this context, the index) of the next instruction to be executed. It is the VM’s calculate_jmp_address function.
With that, we’ve wrapped up the working of the VM! I will leave the actual reversing of this VM as an exercise to the reader. A quick brief on one of the solution approaches:
- Extract the instructions from memory by debugging
- Write a disassembler
- Analyse the disassembly generated (pretty trivial)
Conclusion
I wanted this to be a one-of-a-kind challenge, since I had never seen many mixed mode samples in CTFs. I hope it served as kind of an intro to mixed mode analysis as well as reversing. And most of all I hope you guys had fun solving the challenge!
As always, you can always reach out to me on Twitter/X if you have any doubts/suggestions. :)